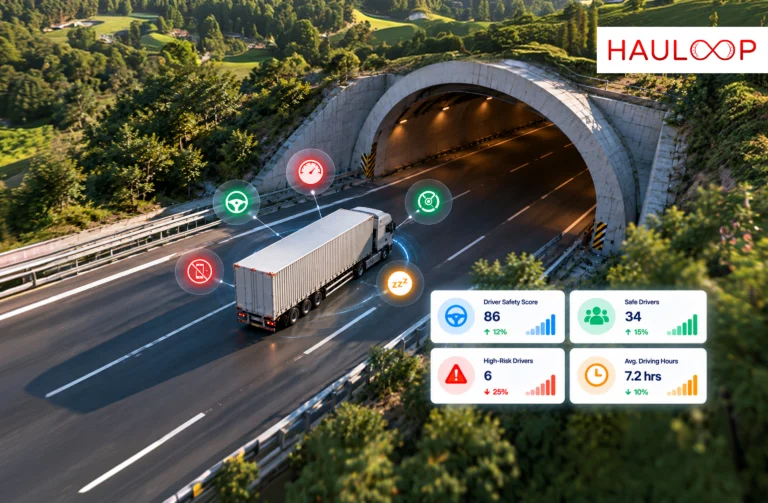

Driver A records eight harsh-driving events during 2,000 kilometres of motorway work. Driver B records six events while covering 400 kilometres of congested city deliveries.
If the manager compares only the totals, Driver A appears worse.
But Driver A recorded four events per 1,000 kilometres. Driver B recorded 15. The event rate changes the picture and the route conditions add another layer that the numbers cannot explain alone.
This principle is already used in wider road-safety reporting. The National Highway Traffic Safety Administration reported 1.19 traffic fatalities per 100 million vehicle miles travelled in 2024. The rate connects the outcome with driving exposure instead of presenting only a national total.
Fleets face the same comparison problem. Drivers cover different distances, spend different hours on the road and operate across very different routes, vehicles and duties. A raw event count or final score can become misleading when those differences are ignored.
Let’s examine how to compare driver safety scores fairly without removing the operational context that gives each score its meaning.
Raw Event Totals do not Represent Equal Driving Exposure
A driver who covers 8,000 kilometres in a month has more opportunities to encounter traffic, weather changes, roadworks and unexpected hazards than someone covering 1,500 kilometres.
The same problem applies to time. A field-service driver may cover fewer kilometres but spend many hours moving through dense streets and making frequent stops. A long-haul driver may cover far more distance with fewer braking and acceleration cycles.
Raw totals do not account for either difference.
Before comparing drivers, the fleet should define the most relevant exposure measure. Common options include:
- Distance travelled
- Driving hours
- Number of completed trips
- Number of stops or deliveries
- Time spent in specific operating conditions
The denominator should match the work. Distance may suit line-haul operations, while driving hours or stops may add more meaning for urban delivery and field-service fleets.
Compare Event Rates Before You Compare the Final Scores
A simple event rate gives the manager a more balanced starting point:
Event rate per 1,000 km = Recorded events ÷ Distance travelled × 1,000
Using the opening example:
- Driver A: 8 ÷ 2,000 × 1,000 = 4 events per 1,000 km
- Driver B: 6 ÷ 400 × 1,000 = 15 events per 1,000 km
Driver B recorded fewer events but a higher event rate.
This does not automatically make Driver B less safe. City driving normally involves more stops, turns, pedestrians and sudden traffic changes. The calculation corrects for distance, but it does not yet correct for operating conditions.
The fleet should apply one calculation consistently within a defined comparison group. Mixing per-trip totals for one driver with per-kilometre rates for another creates a new source of unfairness.
Compare Drivers Doing Similar Work Before Building a Ranking
The fairest comparison is usually between drivers with similar operating exposure.
A long-haul driver should be compared primarily with other drivers covering comparable routes, vehicles and loads. Urban delivery drivers should be reviewed against others handling similar stop density, traffic and customer schedules.
Useful comparison groups may consider:
- Long-haul, regional or last-mile duty
- Vehicle class and load type
- Day, night or rotating shifts
- Urban, rural or motorway routes
- Typical number of stops
- Seasonal traffic or weather conditions
Hauloop’s trip history helps managers review completed routes, stops, delays and movement patterns. Our article on stop recognition also explains why a genuine service stop must be separated from congestion or roadside waiting before performance is assessed.
Grouping similar work does not remove every difference, but it makes the benchmark more relevant than a fleet-wide league table.
Review the Event Context Before Calling the Behaviour Unsafe
An event record shows that a configured threshold was crossed. It may not show why.
A harsh-braking event could result from poor following distance. It could also be a correct response to a pedestrian, sudden congestion or another vehicle cutting across the lane.
Managers should review the event time, location, speed, route and surrounding vehicle activity. Where compatible cameras are fitted, dashcam integration can connect video with the recorded event and provide additional context.
Location quality matters as well. A cluster of events near a warehouse entrance, steep descent or congested junction may reveal a route characteristic rather than an individual habit. Our guide to reliable geofencing explains why location evidence must account for GPS uncertainty before it is used in operational decisions.
The purpose of context is not to excuse every event. It is to distinguish preventable behaviour from a necessary response.
Use Longer Trends to Separate a Pattern From One Difficult Trip
One trip can be unusual. A road closure, extreme weather, unfamiliar vehicle or emergency stop may temporarily change a driver’s event rate.
A fair comparison should therefore use a review period long enough to reveal a pattern. The correct period depends on the fleet’s duty cycle and how frequently each driver operates.
Managers can compare:
- The current period with the driver’s own previous result
- The driver with peers doing similar work
- Repeated events on the same route or vehicle
- Performance before and after coaching
Hauloop’s automated reports can organise recurring fleet performance information for review. Completed-trip evidence can also be checked against the wider movement data described in our guide to live fleet tracking.
A driver who records one difficult week and then returns to their normal range needs a different response from someone whose event rate rises steadily across several comparable periods.
Make the Comparison Understandable to the Driver
A safety comparison should be explainable to the person being assessed.
Drivers should know which behaviours are monitored, how exposure is considered, which period is being reviewed and what evidence supports the result. If an event is assigned to the wrong driver or vehicle, there should be a process for correcting it.
The manager should also explain why the peer group is relevant. Comparing a city-delivery driver with a motorway driver without discussing the difference will make the score feel arbitrary, even when the underlying system is consistent.
A clear review can follow five steps:
- Show the final score or event rate.
- Explain the comparison period and exposure measure.
- Review the specific behaviours behind the result.
- Consider relevant route, vehicle and trip conditions.
- Agree on one measurable improvement to review later.
Transparency strengthens coaching because the driver can see the evidence, understand the expectation and challenge genuine data errors.
Conclusion: A Fair Comparison Needs More Than the Final Score
Return to the two drivers from the beginning. Driver A recorded more events, but also travelled five times farther. Driver B recorded fewer events but a higher rate per 1,000 kilometres and completed a very different type of work.
The raw count could not provide a fair answer. The event rate improved the comparison, but route, vehicle, duty cycle and event context were still required before the manager could decide what the difference meant.
That is how fleets should compare driver safety scores fairly: normalise for exposure, compare similar work, review the evidence and judge trends over an appropriate period. The goal is not to create a perfect league table. It is to identify the right coaching need without penalising drivers simply because they travelled farther or handled more demanding routes.
AI-powered fleet management software can connect driver performance with trip history, route context and supporting event evidence. Book a Demo to see how fairer safety comparisons can support your fleet and drivers.
Frequently Asked Questions
How should fleets compare driver safety scores?
Fleets should compare drivers using a consistent scoring method, normalise events by distance or driving time and group drivers performing similar work. Managers should then review route, vehicle and event context before deciding what the difference means.
Why should driving distance be included in the comparison?
Drivers covering more distance have more exposure to traffic and road hazards. Dividing events by distance creates a rate that is more comparable than a raw total, although route and duty conditions must still be considered.
Should city and motorway drivers be ranked together?
Not without careful adjustment. City drivers normally face more stops, turns, pedestrians and traffic changes. Comparing them directly with motorway drivers can produce misleading rankings unless the fleet accounts for duty cycle, exposure and operating conditions.
Does every harsh-braking event indicate unsafe driving?
No. Harsh braking can reflect poor anticipation, but it may also be a necessary response to traffic, a pedestrian or another vehicle. Managers should review the location, speed, trip activity and available video before reaching a conclusion.
What happens when fleet devices use different event thresholds?
The results may not be directly comparable. Fleets should align thresholds where technically appropriate or separate drivers into comparable device groups. Hardware differences, calibration and available sensor data should be documented when interpreting the scores.
What is the best period for comparing driver performance?
There is no universal period. It should be long enough to include representative work and reduce the effect of one unusual trip. Many fleets combine immediate event review with weekly or monthly trend comparisons across similar duties.