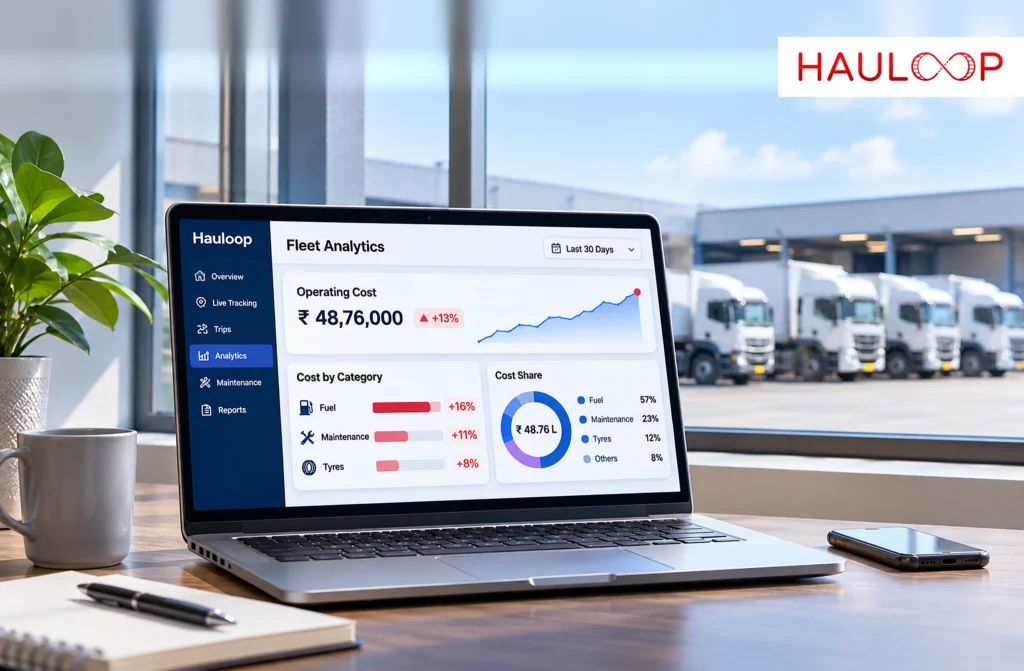
The monthly fleet report shows that operating cost increased by 9%.
Fuel spending is higher, maintenance cost has moved upward and on-time performance has declined. The totals confirm that something changed, but they do not tell the manager what to change next.
Did one vehicle become more expensive? Did a recurring route create additional waiting or empty kilometres? Did several trips exceed their expected cost, or was one order priced below the work required?
Cost pressure makes those questions important. The American Transportation Research Institute reported that the average cost of operating a truck reached $2.336 per mile in 2025. The surveyed US figure is not an Indian benchmark, but its cost research shows why a total operating figure needs to be broken into its underlying components.
The best fleet analytics software in India should not stop at reporting that cost increased. It should identify where the change began, preserve the operating context and help the right person decide what to investigate.
Let’s examine how fleet analytics should turn a higher total into a clear operational question.
Fleet Analytics Should Explain the Result, Not Just Display It
Fleet analytics software converts connected vehicle, trip, fuel, maintenance and cost records into comparisons, trends and exceptions.
A useful view should help managers answer:
- What changed?
- Where did it change?
- Is it an isolated result or a repeated pattern?
- Which records support the finding?
- Who needs to act next?
Hauloop’s custom dashboards can organise relevant KPIs for operations, finance and management. The value does not come from displaying the largest number of charts. It comes from helping each user move from a fleet-level result to the vehicle, route or trip behind it.
Relevant dashboard KPIs should reflect the decisions made by the fleet. A delivery operator may prioritise completed stops and customer windows, while a long-distance carrier may focus on loaded kilometres, empty running and trip contribution.
Follow the Cost from the Fleet Total to the Exact Operation
A fleet-wide average can hide a high-cost asset or an unprofitable movement. Analytics should allow the manager to review the result at four connected levels.
Per vehicle: Is one asset consuming more fuel, requiring more repairs or spending more time unavailable than comparable vehicles?
Per route: Are congestion, tolls, waiting, diversions or empty returns repeatedly increasing cost?
Per trip: Which event caused one completed movement to differ from its expectation?
Per order: Did the customer revenue recover the direct and allocated costs of completing the work?
Hauloop’s vehicle costs can connect fuel, maintenance and operational expenses with the relevant asset.
The levels should remain connected. If Vehicle MH-14 shows a higher monthly cost, the manager should be able to see the routes and trips it completed. The increase may belong to the asset, or the vehicle may simply have been assigned the most demanding work.
Define What the Cost Includes Before Comparing It
“Vehicle cost” can mean different things in different reports.
One calculation may include fuel, maintenance and tolls. Another may add tyres, insurance, finance, depreciation and allocated overhead. Comparing them without a common boundary produces an unreliable conclusion.
Every cost metric should identify:
- The expenses included and excluded
- The reporting period
- The vehicle, route or trip boundary
- The distance used in the calculation
- The method used to allocate fixed costs
- Whether empty movement was included
Cost per kilometre should divide defined costs by distance from the same period. Loaded distance and total distance answer different questions, while trip contribution and company net profit are not interchangeable.
A complete trip calculation explains why fuel, driver cost, tolls, maintenance, tyre wear, ownership cost and empty-return risk must be separated before a rate is judged profitable.
Compare Similar Work Before Labelling a Result as Waste
A number becomes meaningful when it is compared with a reasonable expectation for similar work.
Consider three vehicles completing comparable regional deliveries:
| Measure | Expected range | Vehicle MH-14 | Difference |
| Total distance | 610–630 km | 642 km | 12 km above range |
| Trip duration | 20–23 hours | 27 hours | 4 hours above range |
| Direct trip cost | ₹31,500–₹33,200 | ₹36,450 | ₹3,250 above range |
The result identifies MH-14 as an exception. It does not prove that the driver wasted fuel or that the vehicle is inefficient.
The trip may have carried a heavier load, followed an approved diversion or waited longer at the customer site. If the same vehicle produces higher costs across several comparable routes, its fuel performance or mechanical condition may require investigation. If different vehicles show the same increase on one route, the route or customer process is the stronger lead.
Fleet performance analytics should narrow the investigation before responsibility is assigned.
Repeated Patterns Matter More Than One Expensive Trip
One unusual movement may have a valid explanation. A gradual trend across similar work deserves closer attention.
Suppose one vehicle’s operating cost moves from ₹42.10 to ₹42.70, ₹44.20 and ₹45.80 per kilometre across four comparable periods. No single increase appears extreme, but together they show deterioration.
The next step is to compare the cost trend with related signals:
- Did fuel consumption increase?
- Did maintenance events or downtime become more frequent?
- Did the vehicle spend longer waiting or idling?
- Was it assigned different routes or heavier loads?
- Did empty running increase?
- Did any data source stop reporting correctly?
This connection prevents a fuel issue, maintenance issue and route issue from being treated as separate problems when they may describe the same developing pattern.
Analytics should also preserve valid exceptions. An abnormal load, emergency diversion or authorised additional collection should not distort the expected range for ordinary work.
Deliver the Finding While the Next Decision Can Change
Month-end reporting remains important for finance, but operations cannot wait until the end of the month to discover that the same high-cost trip has been repeated.
An end-of-trip view can compare expected and actual distance, duration, waiting, fuel and direct cost. The team can then decide whether the next movement needs a different vehicle, rate, route, customer window or maintenance inspection.
Hauloop’s automated reports can deliver selected information according to a defined schedule or workflow. The report should reach the person who owns the decision:
- Operations for trip and route variance
- Maintenance for asset-related deterioration
- Finance for cost allocation and rate recovery
- Management for recurring commercial trends
The process described in data into action matters here: validate the signal, identify its operational context, assign an owner and record the result.
Before choosing analytics software, test it with a completed vehicle or route whose cost is already known. Confirm that it reproduces the verified result, defines every calculation, exposes missing information and allows the manager to reach the supporting records.
Conclusion: Know Where the Cost Changed Before Deciding What to Cut
Return to the monthly report showing a 9% increase. The total alone could encourage a general cost-cutting response without identifying the operation responsible.
Fleet analytics provides the missing path. It moves from the fleet total to the vehicle, route, trip and order behind it; compares the result with similar work; and shows whether the difference is isolated or developing into a trend.
That is what the best fleet analytics software in India should provide: not another dashboard total, but a clear starting point for deciding whether the fleet should inspect a vehicle, change an assignment, review a customer process or correct a rate.
An AI-powered fleet Management Software can connect vehicle, trip, fuel, maintenance and cost information within one operational view. Book a Demo to test Hauloop using a cost result your team already understands.
Frequently Asked Questions
What should fleet analytics show when one vehicle becomes more expensive?
If MH-14 costs more than comparable vehicles, the software should separate fuel, maintenance, tyres, tolls, downtime and other defined expenses. It should also show the routes and trips involved so the fleet can determine whether the increase belongs to the vehicle or its assigned work.
How can fleet analytics compare two routes fairly?
Compare routes completed by similar vehicle types under comparable loads and operating conditions. Include total and empty distance, stops, waiting, tolls and fuel. A short urban delivery run should not be judged against a long-distance trip using one fleet-wide target.
Can fleet analytics identify an unprofitable order?
It can support the calculation when order revenue and relevant trip costs are available. For example, a delivery may cover fuel and tolls but fail to recover driver time, waiting, maintenance, tyres and ownership cost. The calculation boundary must be visible.
Why should analytics compare expected and actual performance?
Suppose a trip was expected to cost ₹32,000 but finished at ₹36,450. The variance tells the manager where to investigate. Route changes, waiting, load, vehicle condition and data quality should be reviewed before the cause is assigned.
Should every department receive the same fleet report?
No. Operations may need trip exceptions, maintenance needs asset trends, and finance needs cost allocation. Each team should receive the information connected to its decisions while retaining access to the same underlying records.
How should an Indian fleet test analytics software before purchasing it?
Use one completed vehicle, route or reporting period with verified costs. Confirm that the software reproduces the known result, defines its calculations, exposes missing data and links the finding to the records required for investigation.