A fleet can generate thousands of data points every day and still leave managers asking basic questions.
Which vehicles need attention? Are operating costs moving in the wrong direction? Which drivers or trips are affecting performance? Is the problem happening across the fleet or only within a few vehicles?
Having data does not automatically answer these questions.
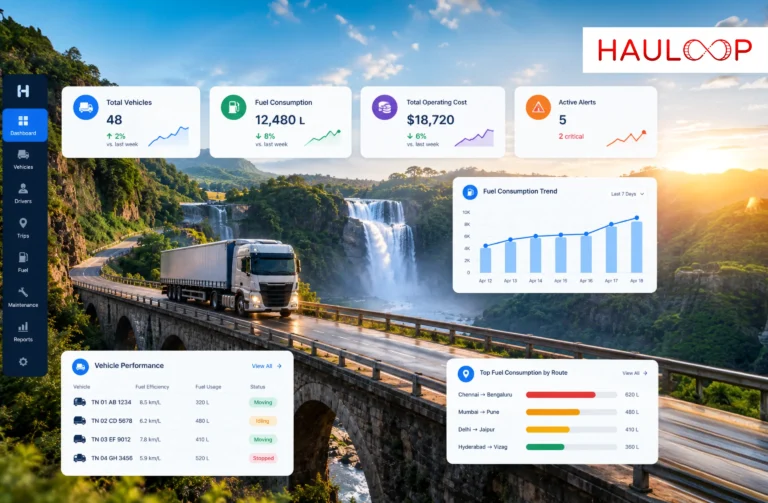
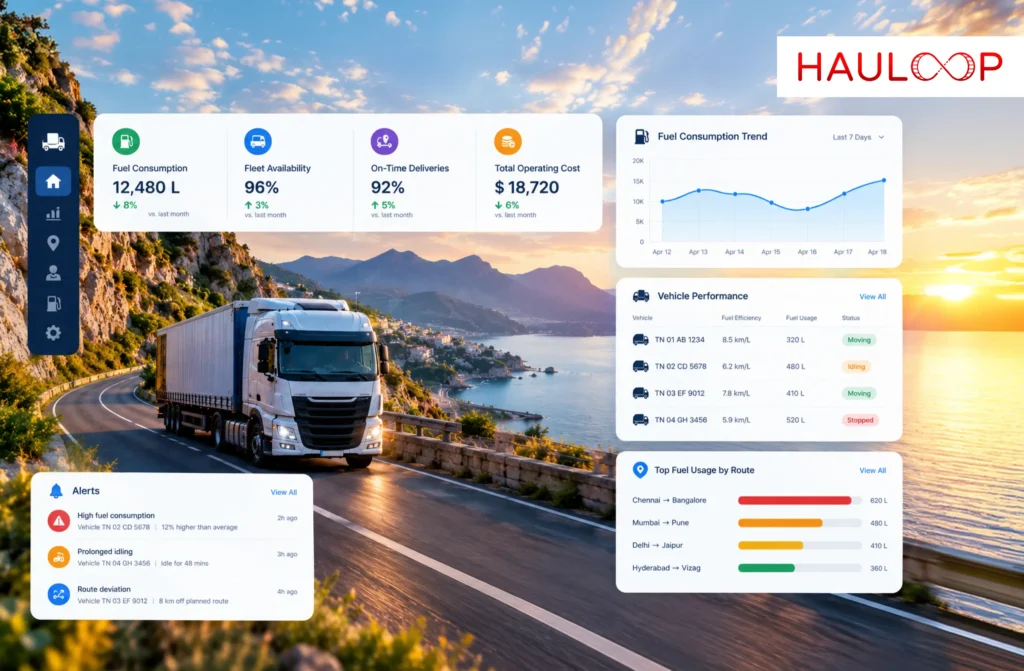
The information has to be organised around the decisions a fleet manager actually makes. That is where a fleet intelligence dashboard becomes useful. Instead of displaying every available number, it brings the most relevant fleet KPIs, performance metrics, trends, and operational information into one view.
But what should that dashboard actually show?
What is a Fleet Intelligence Dashboard?
A fleet intelligence dashboard is a centralised view of selected information from across fleet operations.
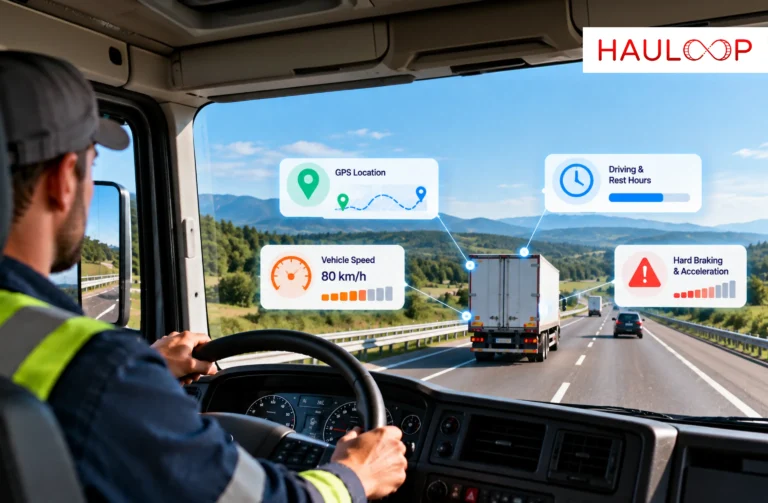
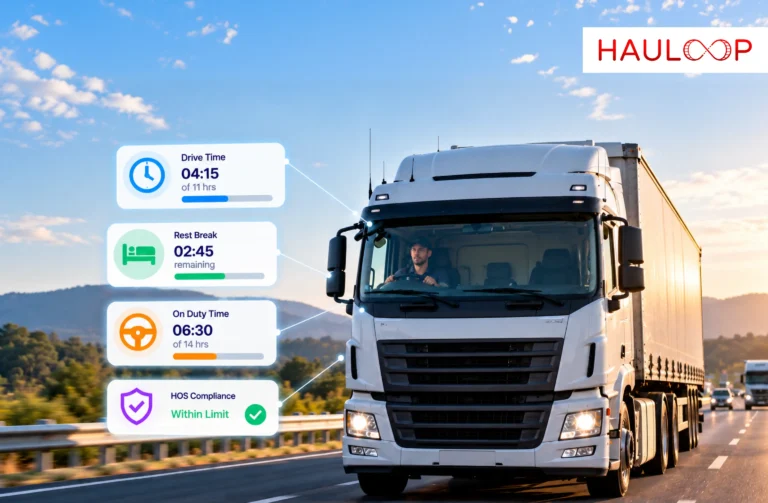
It can bring together data from vehicles, drivers, trips, costs, and operational activities so managers do not have to review each area separately.
The important part is deciding what deserves space on the dashboard.
If 50 metrics are displayed but only eight influence daily decisions, the remaining information may create more noise than value.
A useful dashboard therefore starts with the questions the fleet needs to answer, not with how many charts can fit on the screen.
Which Fleet KPIs should be on the Dashboard?
There is no universal set of KPIs that works for every fleet.
A delivery fleet, long-haul transport operation, service fleet, and rental fleet can have very different priorities.
Depending on the operation, a dashboard may need to track areas such as:
- Vehicle performance
- Driver performance
- Trip and route activity
- Fuel usage and costs
- Vehicle availability
- Maintenance performance
- Operational exceptions
- Cost and efficiency trends
The purpose is not to monitor every metric available.
It is to identify the KPIs that reveal whether the operation is performing as expected.
A Custom KPI Dashboard makes this possible by allowing fleets to organise the metrics that matter most to their own operation rather than working from a fixed set of measurements.
Why should Vehicle, Driver and Trip Data be Viewed Together?
Fleet performance rarely has one cause.
Suppose a particular route suddenly becomes more expensive to operate.
Cost data identifies the result, but it may not explain it.
The manager may need to understand which vehicles completed the route, how individual trips performed, and whether other operational factors changed during the same period.
Looking at those areas separately makes investigation slower.
A multi-metric fleet dashboard allows performance, cost, vehicle, and operational information to be considered together.
This provides context around the number.
Instead of seeing only that a KPI has changed, managers have a clearer starting point for understanding what may have influenced it.
Why do Different Teams Need Different Dashboard Views?
The KPI that matters to dispatch may not be the KPI that matters to finance.
Operations teams may need to know what is happening across vehicles and trips right now.
Finance may be more interested in fuel costs, operating expenses, and longer-term cost patterns.
Management may want a broader view of overall fleet performance and major exceptions.
Giving everyone the same dashboard can therefore make the information less useful.
Role-based dashboard views allow different teams to work with information relevant to their responsibilities.
The underlying fleet data can remain connected while the view changes according to the person using it.
That is one of the reasons customization matters in fleet intelligence.
What is the Role of Real-Time Data?
Historical information tells managers what happened.
Real-time information helps them understand what is happening now.
Both have a place on a fleet dashboard.
Historical trends can reveal whether performance is improving or deteriorating over time. Real-time metrics can surface changes while operations are still underway.
For example, a monthly performance report may reveal a recurring problem that requires a broader operational change.
A real-time dashboard may reveal an issue occurring during today’s operation that needs immediate investigation.
Fleet intelligence becomes more useful when teams can work with both perspectives rather than relying entirely on retrospective reporting.
Why should a Dashboard Include Trends, Not Just Current Numbers?
A single number can be misleading without context.
Suppose a KPI currently reads 82%.
Is that good or bad?
If it was 65% three months ago, performance may be improving.
If it was 94% last month, something may have changed.
Trend information gives the current metric a reference point.
It helps managers determine whether a result is normal, improving, deteriorating, or unusually different from previous performance.
This is why a useful dashboard should not only answer:
“What is the number?”
It should also help answer:
“How is that number changing?”
What are Drill-Down Insights?
A high-level KPI tells the manager where to look.
It rarely provides the entire explanation.
Suppose overall fleet performance drops.
The manager may need to determine whether the change came from one region, a group of vehicles, certain trips, or another part of the operation.
Drill-down insights allow users to move from the high-level metric into the information behind it.
The investigation might follow a path such as:
Fleet → Vehicle group → Vehicle → Trip → Operational detail
Instead of opening several reports to reconstruct the issue, the manager can move progressively deeper into the relevant data.
This is an important difference between simply displaying KPIs and actually helping users investigate them.
How do Alerts Fit Into the Dashboard?
Managers should not have to watch every metric continuously.
If an important change occurs, it needs to be noticeable.
Integrating live alerts with dashboard information allows operational exceptions and performance changes to appear alongside the KPIs already being monitored.
That creates a clearer workflow:
See the alert → Review the KPI → Drill into the data → Decide what needs attention.
The dashboard becomes a place for both routine monitoring and exception management.
Why does Dashboard Customization Matter?
No two fleets operate exactly the same way.
Even within the same company, departments may need completely different views.
A fixed dashboard forces the fleet to adapt its decisions to the software.
A custom dashboard allows the information to adapt to the operation.
Flexible widgets can be used to organise the metrics and information each user needs most frequently.
This also helps reduce dashboard clutter.
The objective is not to put everything on one screen.
It is to make the information that matters easier to find.
What should Fleet Managers Expect from Their Dashboard?
A useful fleet intelligence dashboard should help a manager answer four questions:
What is happening?
What has changed?
Where is the change coming from?
Does something require action?
If the dashboard only displays data but managers still need multiple reports and spreadsheets to answer those questions, it has not solved the underlying problem.
The best dashboard is therefore not necessarily the one containing the most metrics.
It is the one that gives each user the clearest view of the fleet information required for their decisions.
Conclusion
Fleet intelligence is not about displaying every piece of data the fleet generates.
It is about selecting the information that provides useful operational context.
Vehicle, driver, trip, cost, and performance KPIs become more valuable when managers can view related information together, monitor changes over time, and investigate what sits behind a high-level result.
That is what turns a fleet dashboard from a reporting screen into an operational tool.
If your fleet needs a clearer way to organise KPIs and performance information, an AI Fleet Management Platform can bring the metrics that matter into a customizable view. Book a demo with Hauloop to see how a custom fleet dashboard can be structured around your operation.
Frequently Asked Questions
What is a fleet intelligence dashboard?
A fleet intelligence dashboard brings selected vehicle, driver, trip, cost, and operational metrics into one view. It helps fleet teams monitor KPIs, understand performance trends, identify changes, and investigate areas that may require attention.
What KPIs should be included in a fleet dashboard?
The right KPIs depend on the fleet's operation and goals. Common areas include vehicle performance, driver performance, trip activity, fuel usage, maintenance, availability, costs, and operational exceptions.
Should every fleet department use the same dashboard?
Not necessarily. Operations, finance, and management often require different information. Role-based dashboards allow each team to focus on relevant metrics while working from connected fleet data.
Why are historical trends important on a fleet dashboard?
Historical trends provide context for current performance. They help managers determine whether a KPI is stable, improving, declining, or behaving unusually compared with previous periods.
What are drill-down insights in fleet management?
Drill-down insights allow users to move from a high-level KPI into more detailed information, such as a particular vehicle, trip, route, team, or operational activity that contributed to the result.
Why is a customizable dashboard better than a fixed dashboard?
Customization allows fleets to prioritise the metrics relevant to their operation and different user roles, reducing unnecessary information and making important performance signals easier to identify.