The operations manager checks one report for vehicle performance.
Fuel information is somewhere else.
Trip data has to be reviewed separately, and management needs another report before the morning meeting.
The fleet has plenty of information.
The problem is getting from that information to a decision quickly.
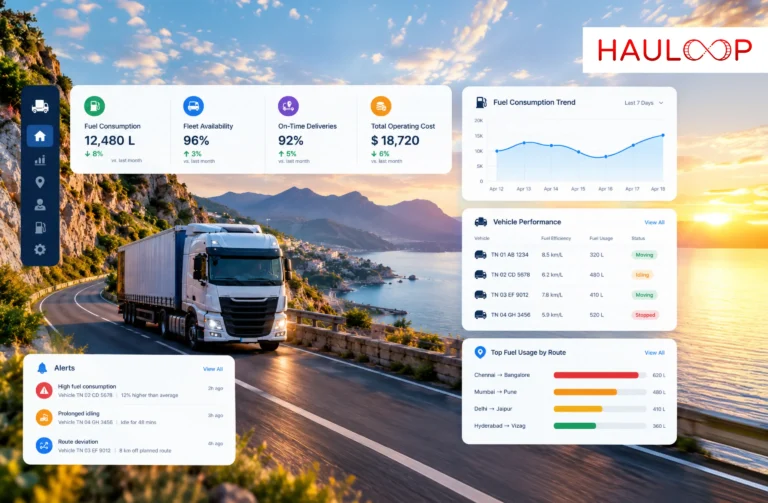
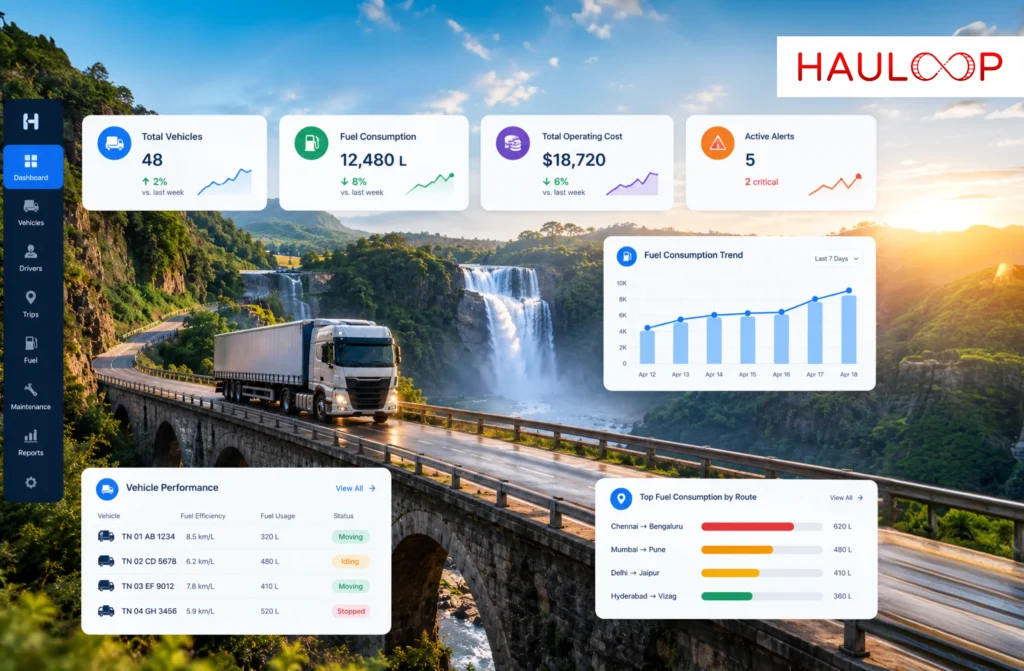
A custom fleet dashboard is designed to shorten that process. It brings selected fleet data into one environment, organises it into meaningful KPIs, highlights changes, and lets managers investigate the information behind those changes.
The value is not simply having a dashboard.
It is reducing the steps between seeing what is happening and deciding what to do about it.
Why does Fleet Data become Difficult to Use?
Fleet operations generate information continuously.
Vehicles create performance data. Drivers generate activity information. Every trip produces operational records. Fuel, maintenance, costs, routes, and alerts add additional layers.
The challenge appears when this information remains separated.
A manager may know that costs increased but need another report to understand which vehicles were responsible.
Operations may see that trip performance changed but need to search elsewhere for additional context.
The fleet is technically data-rich but operationally information-poor.
Bringing the relevant information into a unified fleet data view is the first step toward changing that.
Step 1: How is Fleet Data Brought Together?
A useful dashboard begins before the charts appear.
Relevant data needs to be collected from vehicles, drivers, trips, and fleet operations.
The objective is to create a common information base that can support different types of analysis.
Without this foundation, the dashboard becomes another isolated reporting tool.
Hauloop’s custom dashboard process starts by gathering operational information into one place before organising it into usable metrics.
This means the dashboard can represent different parts of the operation rather than providing a narrow view of one area.
Step 2: How does Raw Data become a Useful KPI?
Raw data does not automatically tell a manager whether the fleet is performing well.
It needs structure.
This is where KPIs become important.
A KPI takes a broader collection of information and turns it into a measurement connected to an operational objective.
But more KPIs do not necessarily create better intelligence.
If managers have to analyse dozens of metrics before finding the important one, the dashboard has simply replaced report overload with dashboard overload.
The useful question is:
Which measurements actually influence the decisions this team makes?
Those are the metrics that deserve priority.
Step 3: Why Build Different Dashboard Views?
Once the relevant metrics are identified, they need to be organised around the user.
A dispatcher, finance manager, and senior manager may all work with fleet information, but they do not make the same decisions.
This is why role-based fleet dashboards are useful.
Operations can prioritise active fleet performance and trip information.
Finance can concentrate on costs and financial performance.
Management can focus on higher-level KPIs and trends.
Hauloop’s customizable dashboard uses flexible widgets and role-based views so the same broader fleet environment can support different decision-making needs.
Step 4: How does Visualization Make Fleet Data Easier to Understand?
A spreadsheet containing hundreds of rows may contain the answer a manager needs.
Finding it is the problem.
Visualization helps make patterns and changes easier to recognise.
Charts, KPI cards, trends, and structured dashboard components can make it clearer when performance changes from its normal range.
The objective is not to make fleet data decorative.
It is to reduce the amount of interpretation required before a manager understands what the data is saying.
A well-structured dashboard should make important changes stand out rather than forcing the user to search for them.
Step 5: Why Monitor Fleet Performance in Real Time?
Some fleet decisions lose value when they happen too late.
If an operational issue occurs this morning, discovering it in next week’s report may explain what went wrong but does little to help today’s operation.
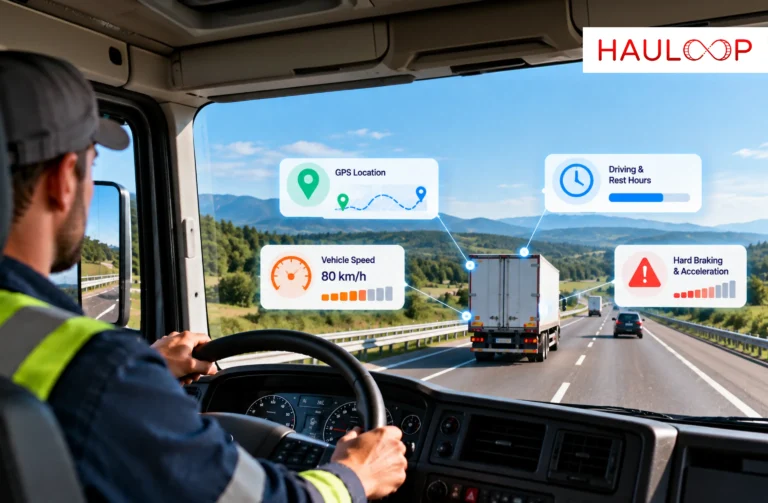
Real-time performance tracking allows fleet teams to monitor relevant changes while work is underway.
That does not mean every KPI needs an immediate response.
It means managers have access to current information when timing matters.
Historical reporting can then be used for a different purpose: identifying recurring patterns and longer-term performance changes.
Together, real-time and historical information provide both immediate and strategic context.
Step 6: How do Alerts Help Managers Find What Matters?
A fleet dashboard should not require constant staring.
As the number of vehicles, drivers, and trips grows, manually watching every metric becomes unrealistic.
Alerts help shift attention toward exceptions.
When an important update or performance change occurs, it can be surfaced directly within the dashboard environment.
The manager can then review the relevant metric instead of searching the entire fleet for potential problems.
The process becomes:
Alert → KPI → Context → Decision
That is much faster than discovering an issue only after manually reviewing multiple reports.
Step 7: What Happens When a KPI Looks Wrong?
Seeing a problem is not enough.
Managers need to understand what caused it.
Suppose a dashboard shows a decline in an important operational KPI.
The next question is:
Where did that change come from?
This is where drill-down insights become valuable.
A user can move from the high-level measurement toward the vehicles, trips, routes, teams, or other information behind it.
Instead of leaving the dashboard and beginning a separate investigation, the manager can follow the data deeper.
This turns a KPI from an endpoint into the beginning of the decision process.
How does a Multi-Metric Dashboard Provide Better Context?
Fleet problems rarely exist in isolation.
A change in operating cost may be connected to vehicle performance.
A trip issue may relate to a particular route or another operating condition.
A single metric identifies the result.
Related metrics provide context.
A multi-metric dashboard allows managers to consider performance, cost, and operational information together.
This can make relationships easier to investigate without assuming that one data point alone explains the situation.
The goal is not necessarily to provide an automatic answer.
It is to give the decision-maker enough relevant context to reach the answer faster.
How does this Reduce Time Spent Switching Between Reports?
Consider the traditional process:
Open report → Find metric → Open another system → Compare information → Export data → Investigate → Decide
Every additional step adds time.
It also creates opportunities for teams to work from different versions of information.
A centralized dashboard changes the workflow:
See KPI → Identify change → Drill down → Review context → Act
The number of decisions may not change.
The effort required to reach each decision can.
That is one of the practical benefits of bringing fleet intelligence into a single operational view.
What Makes a Fleet Dashboard Actionable?
An actionable dashboard does not simply tell the fleet what happened.
It helps users understand what deserves attention next.
That requires several elements working together:
Relevant KPIs establish what matters.
Real-time information shows what is happening.
Trends show how performance is changing.
Alerts highlight exceptions.
Drill-down information provides context.
Role-based views ensure the information reaches the people responsible for acting on it.
When those elements work together, the dashboard becomes part of the operational workflow rather than a reporting destination.
Conclusion
Fleet data creates value only when people can use it to make decisions.
A custom dashboard helps close the gap between raw information and operational action by collecting relevant data, organising it into meaningful KPIs, presenting it according to each user’s role, monitoring changes, and providing deeper context when something requires investigation.
The objective is not another screen full of charts.
It is a shorter path from data → insight → action.
If your fleet spends too much time moving between reports before reaching a decision, an AI Fleet Management Platform can bring KPIs, alerts, performance data, and operational context into one customizable environment. Book a demo with Hauloop to see how a custom fleet dashboard can support faster fleet decisions.
Frequently Asked Questions
How does a custom fleet dashboard improve decision-making?
A custom dashboard brings relevant KPIs, trends, alerts, and operational information into one view. This can reduce the time managers spend finding and comparing information before understanding what requires attention.
Can fleet dashboards display real-time data?
Yes. Real-time performance tracking can show current fleet activity and performance changes while operations are underway, while historical information provides longer-term context.
What is a multi-metric fleet dashboard?
A multi-metric dashboard displays related performance, cost, vehicle, trip, and operational measurements together so managers can evaluate results with broader context.
How do dashboard alerts help fleet managers?
Alerts draw attention to important updates or changes instead of requiring managers to continuously monitor every KPI. Users can then investigate the relevant information and determine whether action is required.
Can fleet managers investigate a KPI directly from the dashboard?
With drill-down functionality, users can move from a high-level KPI into more detailed information, such as individual vehicles, trips, routes, teams, or other operational data behind the result.
Can custom fleet dashboards reduce manual reporting?
They can reduce reliance on repeatedly switching between separate reports by bringing selected KPIs and operational information into a centralized view. Reports may still be needed for specific analysis, documentation, or historical review.