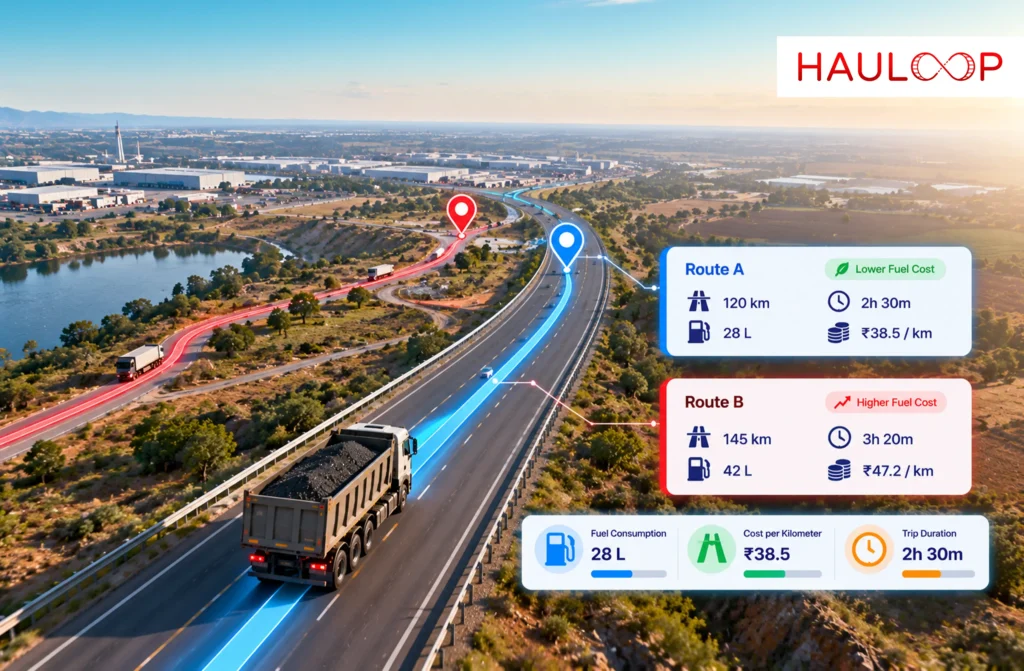
Two vehicles complete different delivery routes.
The first travels 486 kilometres and consumes 132 litres of fuel. The second covers 398 kilometres using 103 litres. Looking only at total consumption, the second route appears to cost less.
But that comparison leaves out important questions. How much did each litre cost? How much of the distance was travelled with a load? Did either vehicle return empty? Were delays, diversions or prolonged idling part of the journey?
Empty running alone can materially change a route’s cost. The UK Department for Transport reported that Great Britain-registered HGVs travelled 5.84 billion kilometres empty in 2024. That represented 30% of their total distance for the year. Although the figure applies specifically to UK road freight, it shows why total fuel or loaded distance alone cannot explain route performance.
Fuel cost per kilometre connects the money spent on fuel with the complete distance travelled. It helps fleet operators compare routes consistently, identify expensive movements and investigate why a familiar route is becoming more costly.
Let’s examine how to calculate the metric correctly and use it without confusing fuel efficiency with total route profitability.
Fuel Cost per Kilometre Gives Every Route a Comparable Number
Fuel cost per kilometre measures the fuel expense associated with each kilometre travelled during a defined trip, route or operating period.
The basic calculation is:
Fuel cost per kilometre = Total fuel cost ÷ Total kilometres travelled
Suppose the first vehicle consumes 132 litres over 486 kilometres. If fuel costs ₹91.50 per litre:
- Total fuel cost: 132 × ₹91.50 = ₹12,078
- Total distance: 486 kilometres
- Fuel cost per kilometre: ₹12,078 ÷ 486 = ₹24.85
The vehicle therefore spent ₹24.85 on fuel for every kilometre travelled during that route cycle.
This creates a more useful comparison than total litres. A longer route may consume more fuel overall while maintaining a lower cost per kilometre. A shorter route may use fewer litres but perform poorly because of congestion, repeated stopping or prolonged engine-on waiting.
Hauloop’s fuel management capabilities connect fuel activity with vehicles, trips and routes, helping teams review fuel costs in their operational context.
Match the Fuel and Distance to the Same Route Boundary
The calculation becomes unreliable when the fuel and distance come from different parts of the operation.
For example, the fuel figure may cover the loaded delivery and the return journey, while the distance includes only the outward movement. The resulting cost per kilometre would appear higher because all fuel was divided by only part of the distance.
Before calculating the result, define the route boundary. It may cover:
- Depot to customer
- Customer back to the depot
- A complete outward-and-return cycle
- One multi-stop delivery run
- A specific order movement
- A fixed reporting period for one vehicle
Fuel consumed and kilometres travelled must cover the same boundary.
The underlying records also need to be reliable. Fuel purchased is not automatically the same as fuel consumed. Refuelling time, tank readings, sensor calibration, fuel-card data and distance records may need to be aligned before the calculation is accepted.
Our guide to fuel data explains why these inputs should be reviewed together rather than treated as interchangeable values.
Separate Loaded Distance from the Empty Return
A vehicle does not stop creating fuel cost when the cargo is delivered.
Assume the 486-kilometre route includes:
- Loaded distance: 318 kilometres
- Empty return: 168 kilometres
- Complete route distance: 486 kilometres
The total fuel cost remains ₹12,078.
Across the complete route, the fuel cost is:
₹12,078 ÷ 486 = ₹24.85 per kilometre
When the same cost is compared only with the revenue-generating distance:
₹12,078 ÷ 318 = ₹37.98 per loaded kilometre
Both figures are useful, but they answer different questions.
The first shows how much fuel each travelled kilometre cost. The second shows how much fuel expense had to be recovered by the kilometres carrying the customer’s load.
If a fleet records only the loaded journey, the return movement can disappear from commercial analysis even though the vehicle continues consuming fuel. Separating loaded and empty kilometres helps determine whether the problem is poor fuel performance, limited backhaul availability or a customer rate that does not recover the full route cycle.
Compare Routes Performing Similar Work
A lower fuel cost per kilometre does not automatically mean one vehicle or driver performed better.
Vehicle size, load weight, road gradient, traffic, delivery stops, weather, tyre condition and auxiliary-equipment use can all change consumption. A fully loaded urban route should not be judged against a lightly loaded motorway journey using one fleet-wide average.
A fair comparison should consider:
- Vehicle class and engine capacity
- Load weight or capacity used
- Loaded and empty distance
- Number of delivery stops
- Urban, regional or long-distance operation
- Traffic and terrain
- Necessary idling or auxiliary-equipment use
The fleet can then establish an expected range for comparable work.
Suppose repeated journeys on a particular route normally cost between ₹23.80 and ₹25.60 per kilometre. A result of ₹24.90 is likely within its normal range. A result of ₹29.40 is an exception worth examining.
The comparison does not prove that fuel was wasted. It identifies a movement that requires more context.
Investigate What Changed Before Assigning the Cause
A higher cost-per-kilometre result shows that the relationship between fuel cost and distance changed. It does not explain why.
The increase may have been caused by:
- A fuel-price change
- An approved route diversion
- Heavier cargo
- Traffic or extended waiting
- More empty kilometres
- Increased idling
- Tyre or vehicle-condition problems
- Driving-pattern changes
- Unexplained fuel loss
- Incorrect fuel or distance data
The route record should be reviewed before responsibility is assigned.
For example, a driver may return a higher result after following an approved diversion around a road closure. The added distance and congestion created a real cost, but coaching the driver would not correct the underlying problem.
If the same vehicle produces higher figures across several comparable routes, its condition may need attention. If several vehicles show the increase on one route, the issue may involve route conditions, customer waiting time or operating schedules.
Cost per kilometre should begin an investigation, not end it.
Follow the Trend Instead of Reacting to One Trip
One unusual result may have a reasonable explanation. A developing trend is harder to ignore.
Consider a regular route producing the following fuel costs:
- Week 1: ₹24.60 per kilometre
- Week 2: ₹24.95 per kilometre
- Week 3: ₹26.35 per kilometre
- Week 4: ₹27.80 per kilometre
No individual increase appears extreme. Together, they show that the route is becoming progressively more expensive.
The team can then check whether empty distance, fuel price, waiting time, vehicle efficiency or route conditions changed during the same period.
Comparing trends also prevents managers from reacting to every isolated movement. The fleet can prioritise repeated deterioration while documenting valid exceptions such as temporary roadworks, abnormal loads or approved diversions.
The objective is to recognise a change early enough to improve the next route rather than explain the increase only after the monthly total arrives.
Use the Result to Improve the Next Movement
Fuel cost per kilometre becomes valuable when it leads to a practical decision.
Depending on the cause, the fleet may:
- Assign a vehicle better suited to the route
- Change the departure time
- Reduce avoidable waiting
- Plan a backhaul
- Review a recurring diversion
- Inspect a vehicle showing deteriorating efficiency
- Separate customer delays from driving time
- Reassess the rate for a high-cost route
The metric can also help distinguish a route problem from a vehicle problem. If one asset produces higher costs across different routes, the vehicle deserves investigation. If different vehicles produce similar increases on the same route, the route or operating conditions may be responsible.
This creates a clearer basis for action than telling every driver to reduce consumption without identifying where the actual variance occurred.
Fuel Cost per Kilometre is not the Same as Route Profit
A route with a low fuel cost per kilometre can still lose money.
Driver expenses, tolls, tyres, maintenance, finance, insurance, depreciation, loading charges and waiting time also affect the commercial result. The customer rate must recover these costs as well as fuel.
A route with a comparatively high fuel cost per kilometre may still be profitable when its rate and load contribution cover the additional expense.
A complete fleet cost calculation should therefore include all relevant running and ownership costs.
Fuel cost per kilometre explains one important part of route performance. Trip profitability goes further by comparing the movement’s revenue with its complete cost.
Keeping these measures separate prevents a fuel-efficiency figure from being mistaken for the final commercial result.
Conclusion: See Which Routes are Consuming More of Your Margin
Return to the two vehicles from the beginning. Their total fuel consumption showed that one used 132 litres and the other used 103 litres. That information alone could not reveal which route used fuel more efficiently or how empty running affected the cost.
Fuel cost per kilometre provides the missing comparison. When fuel expense and distance are measured across the same route boundary, your business can compare similar movements, identify developing cost increases and investigate whether the cause belongs to the route, vehicle or operating process.
The metric does not calculate total route profit by itself. It shows where fuel is placing greater pressure on the movement so the fleet can improve allocation, planning, backhaul use or pricing before repeating the same conditions.
AI-powered fleet management software can connect fuel, vehicle and route activity within one operational view. Book a Demo to see how route-level fuel information can support better operating and commercial decisions.
Frequently Asked Questions
What is fuel cost per kilometre?
Fuel cost per kilometre is the total fuel expense divided by the distance travelled during the same trip, route or reporting period. It shows how much fuel cost is associated with each kilometre of vehicle movement.
How do you calculate fuel cost per kilometre?
Multiply the fuel consumed by the applicable price per litre. Divide the resulting fuel cost by the kilometres travelled during the same movement. Both values must cover the same route boundary.
Should empty kilometres be included?
Yes, when measuring the cost of the complete route cycle. Loaded and empty kilometres should also be reported separately so the business can distinguish revenue-generating distance from repositioning or return movement.
Why does fuel cost per kilometre change on the same route?
Fuel price, load, traffic, idling, diversions, vehicle condition, weather and driving patterns can affect the result. A change should be reviewed in its operating context before the cause is assigned.
Is fuel cost per kilometre the same as total operating cost?
No. It covers only fuel. Total operating cost may also include wages, tolls, tyres, maintenance, insurance, finance, depreciation and other direct or allocated expenses.
Can fuel cost per kilometre prove that a route is profitable?
No. It measures fuel expense against distance. Route profitability requires the revenue earned from the movement to be compared with fuel and all other relevant operating and ownership costs.